9.4 KiB
Repo Stats
![]() English |
English |
![]() 中文
中文


Achieved on September 1st, 2025
If you would like, you can support the project here!
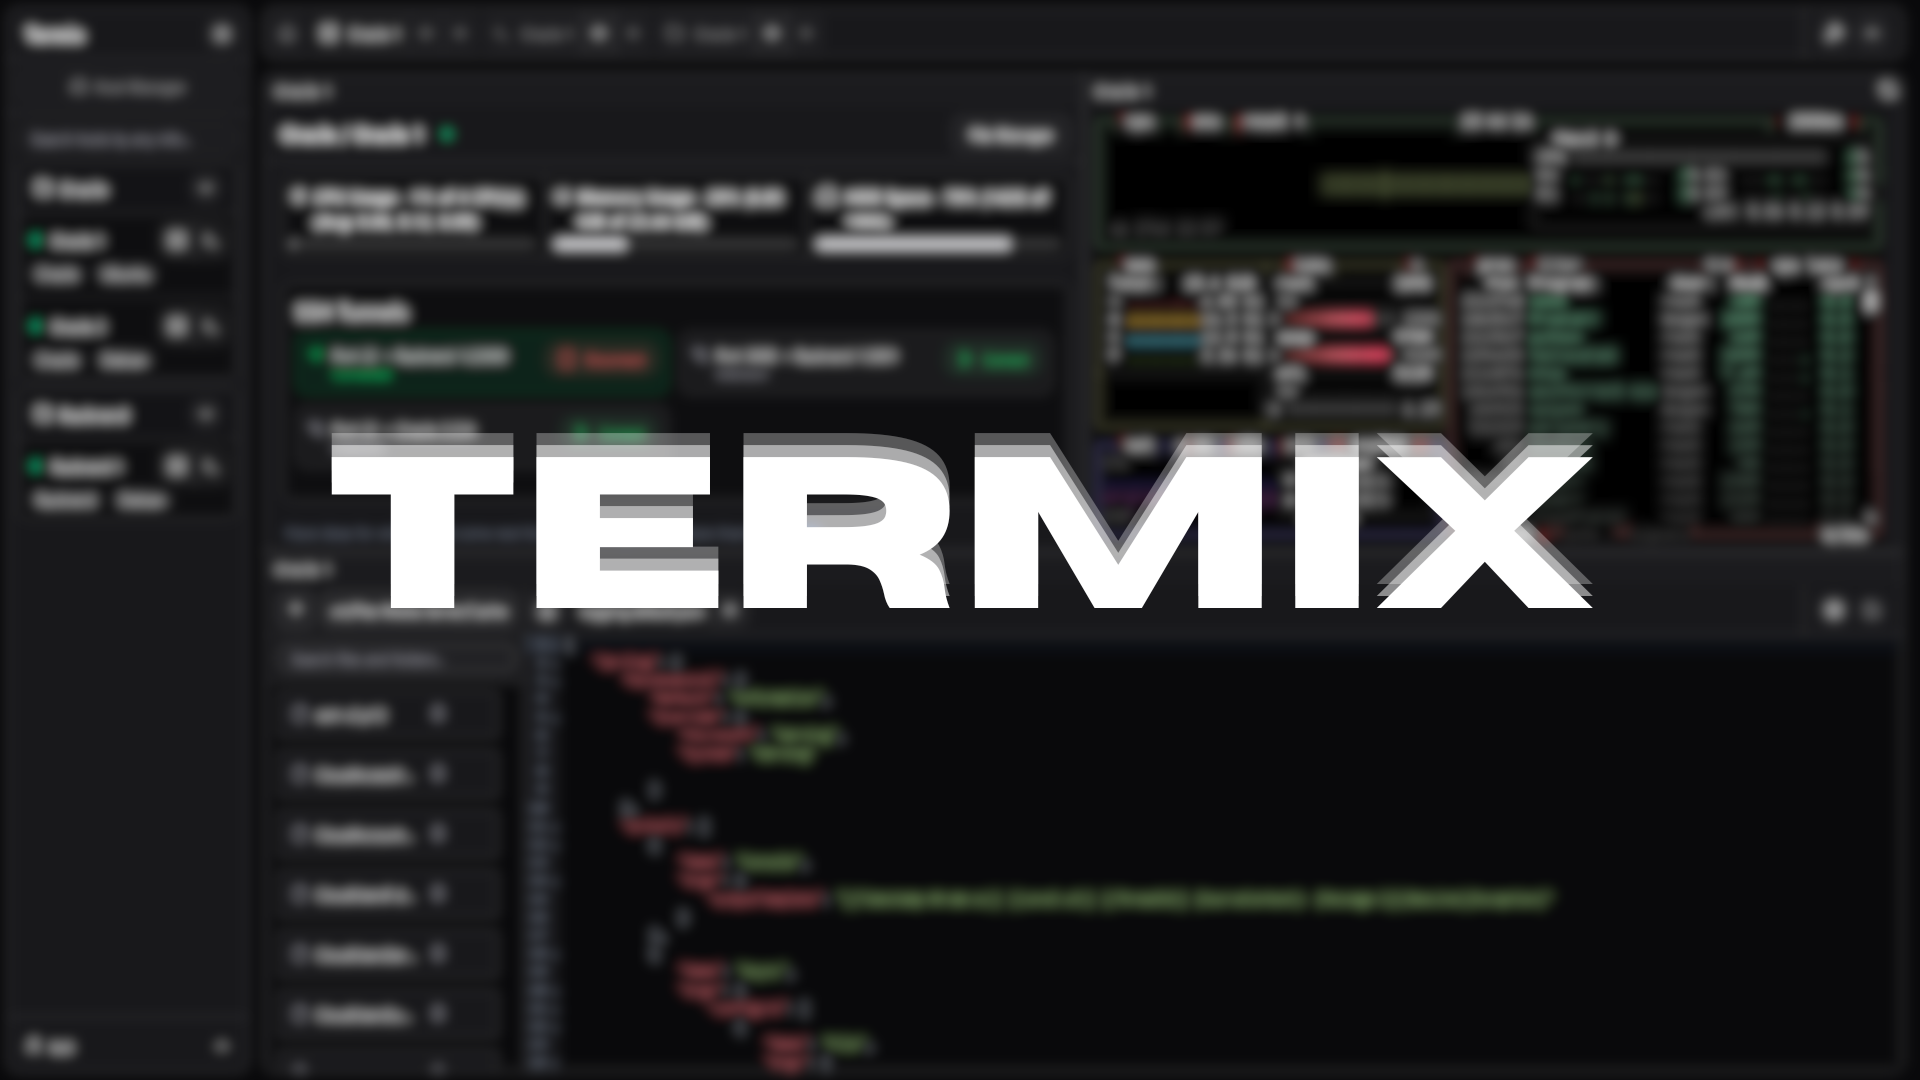
Overview
![]()
Termix is an open-source, forever-free, self-hosted all-in-one server management platform. It provides a multi-platform solution for managing your servers and infrastructure through a single, intuitive interface. Termix offers SSH terminal access, SSH tunneling capabilities, and remote file management, with many more tools to come. Termix is the perfect free and self-hosted alternative to Termius available for all platforms.
Features
- SSH Terminal Access - Full-featured terminal with split-screen support (up to 4 panels) with a browser-like tab system. Includes support for customizing the terminal including common terminal themes, fonts, and other components
- SSH Tunnel Management - Create and manage SSH tunnels with automatic reconnection and health monitoring
- Remote File Manager - Manage files directly on remote servers with support for viewing and editing code, images, audio, and video. Upload, download, rename, delete, and move files seamlessly
- SSH Host Manager - Save, organize, and manage your SSH connections with tags and folders, and easily save reusable login info while being able to automate the deployment of SSH keys
- Server Stats - View CPU, memory, and disk usage along with network, uptime, and system information on any SSH server
- Dashboard - View server information at a glance on your dashboard
- User Authentication - Secure user management with admin controls and OIDC and 2FA (TOTP) support. View active user sessions across all platforms and revoke permissions. Link your OIDC/Local accounts together.
- Database Encryption - Backend stored as encrypted SQLite database files. View docs for more.
- Data Export/Import - Export and import SSH hosts, credentials, and file manager data
- Automatic SSL Setup - Built-in SSL certificate generation and management with HTTPS redirects
- Modern UI - Clean desktop/mobile-friendly interface built with React, Tailwind CSS, and Shadcn
- Languages - Built-in support for English, Chinese, German, and Portuguese
- Platform Support - Available as a web app, desktop application (Windows, Linux, and macOS), and dedicated mobile/tablet app for iOS and Android.
- SSH Tools - Create reusable command snippets that execute with a single click. Run one command simultaneously across multiple open terminals.
- Command History - Auto-complete and view previously ran SSH commands
- Command Palette - Double tap left shift to quickly access SSH connections with your keyboard
- SSH Feature Rich - Supports jump hosts, warpgate, TOTP based connections, etc.
- Network Graph View - Visualize your SSH hosts and their connections in an interactive graph. Drag nodes, pan, zoom, and manage your network topology. Export/import topology as JSON for backup and sharing.
Planned Features
See Projects for all planned features. If you are looking to contribute, see Contributing.
Network Graph View
The Network Graph View is a powerful visualization tool available on the Dashboard that helps you manage and understand your SSH network topology.
Features
- Interactive Graph Visualization - Visualize your SSH hosts and connections using Cytoscape.js with a force-directed layout algorithm
- Host Management - Add or remove hosts from the topology. All your SSH hosts are available for selection
- Connection Management - Create bidirectional connections (edges) between hosts to represent your network topology
- Node Interactions -
- Click nodes to view host details (name, address, status, tags)
- Drag nodes to reposition them manually
- Pan and zoom the graph for better visibility
- Layout Options -
- Automatic force-directed layout with a button to reset
- Manual node positioning with automatic position persistence
- Status Indicators - Nodes display color-coded status:
- Green - Host is online and reachable
- Red - Host is offline or unreachable
- Gray - Status unknown
- Export/Import -
- Export your topology as a JSON file for backup or sharing
- Import previously saved topology files
- Graph Controls -
- Add Host to Topology
- Add Connection between hosts
- Remove Node or Connection
- Auto-layout to reorganize graph
- Zoom In/Out for detail work
- Fit to Screen to see entire topology
How to Use
- Navigate to the Dashboard in Termix
- Click the "Network Graph View" toggle to activate the graph view
- Use the "+" button to add hosts from your SSH Host Manager
- Use the connection button to add relationships between hosts
- Drag nodes to position them as needed
- Click any node to view detailed information about that host
- Use Export to download your topology as JSON
- Use Import to restore a previously saved topology
Limitations & Notes
- The graph view only displays hosts that you've explicitly added to the topology. It does not automatically include all SSH hosts
- Connections are directional (from source to target host)
- Manual node positions are saved automatically when you drag nodes
- The graph updates host status every 30 seconds based on your SSH Host Manager data
- For best performance on mobile devices, limit the topology to 20-30 nodes
- The topology data is stored securely in your encrypted database alongside other SSH configurations
Installation
Supported Devices:
- Website (any modern browser on any platform like Chrome, Safari, and Firefox)
- Windows (x64/ia32)
- Portable
- MSI Installer
- Chocolatey Package Manager (coming soon)
- Linux (x64/ia32)
- Portable (AUR available)
- AppImage
- Deb
- Flatpak (coming soon)
- macOS (x64/ia32 on v12.0+)
- Apple App Store (coming soon)
- DMG
- Homebrew (coming soon)
- iOS/iPadOS (v15.1+)
- Apple App Store
- ISO
- Android (v7.0+)
- Google Play Store
- APK
Visit the Termix Docs for more information on how to install Termix on all platforms. Otherwise, view a sample Docker Compose file here:
services:
  termix:
    image: ghcr.io/lukegus/termix:latest
    container_name: termix
    restart: unless-stopped
    ports:
      - "8080:8080"
    volumes:
      - termix-data:/app/data
    environment:
      PORT: "8080"

volumes:
  termix-data:
    driver: local
Sponsors
Thank you to Digital Ocean for sponsoring Termix and covering our documentation server costs!
Support
If you need help or want to request a feature with Termix, visit the Issues page, log in, and press New Issue.
Please be as detailed as possible in your issue, preferably written in English. You can also join the Discord server and visit the support
channel, however, response times may be longer.
Show-off


Videos and images may be out of date.
License
Distributed under the Apache License Version 2.0. See LICENSE for more information.